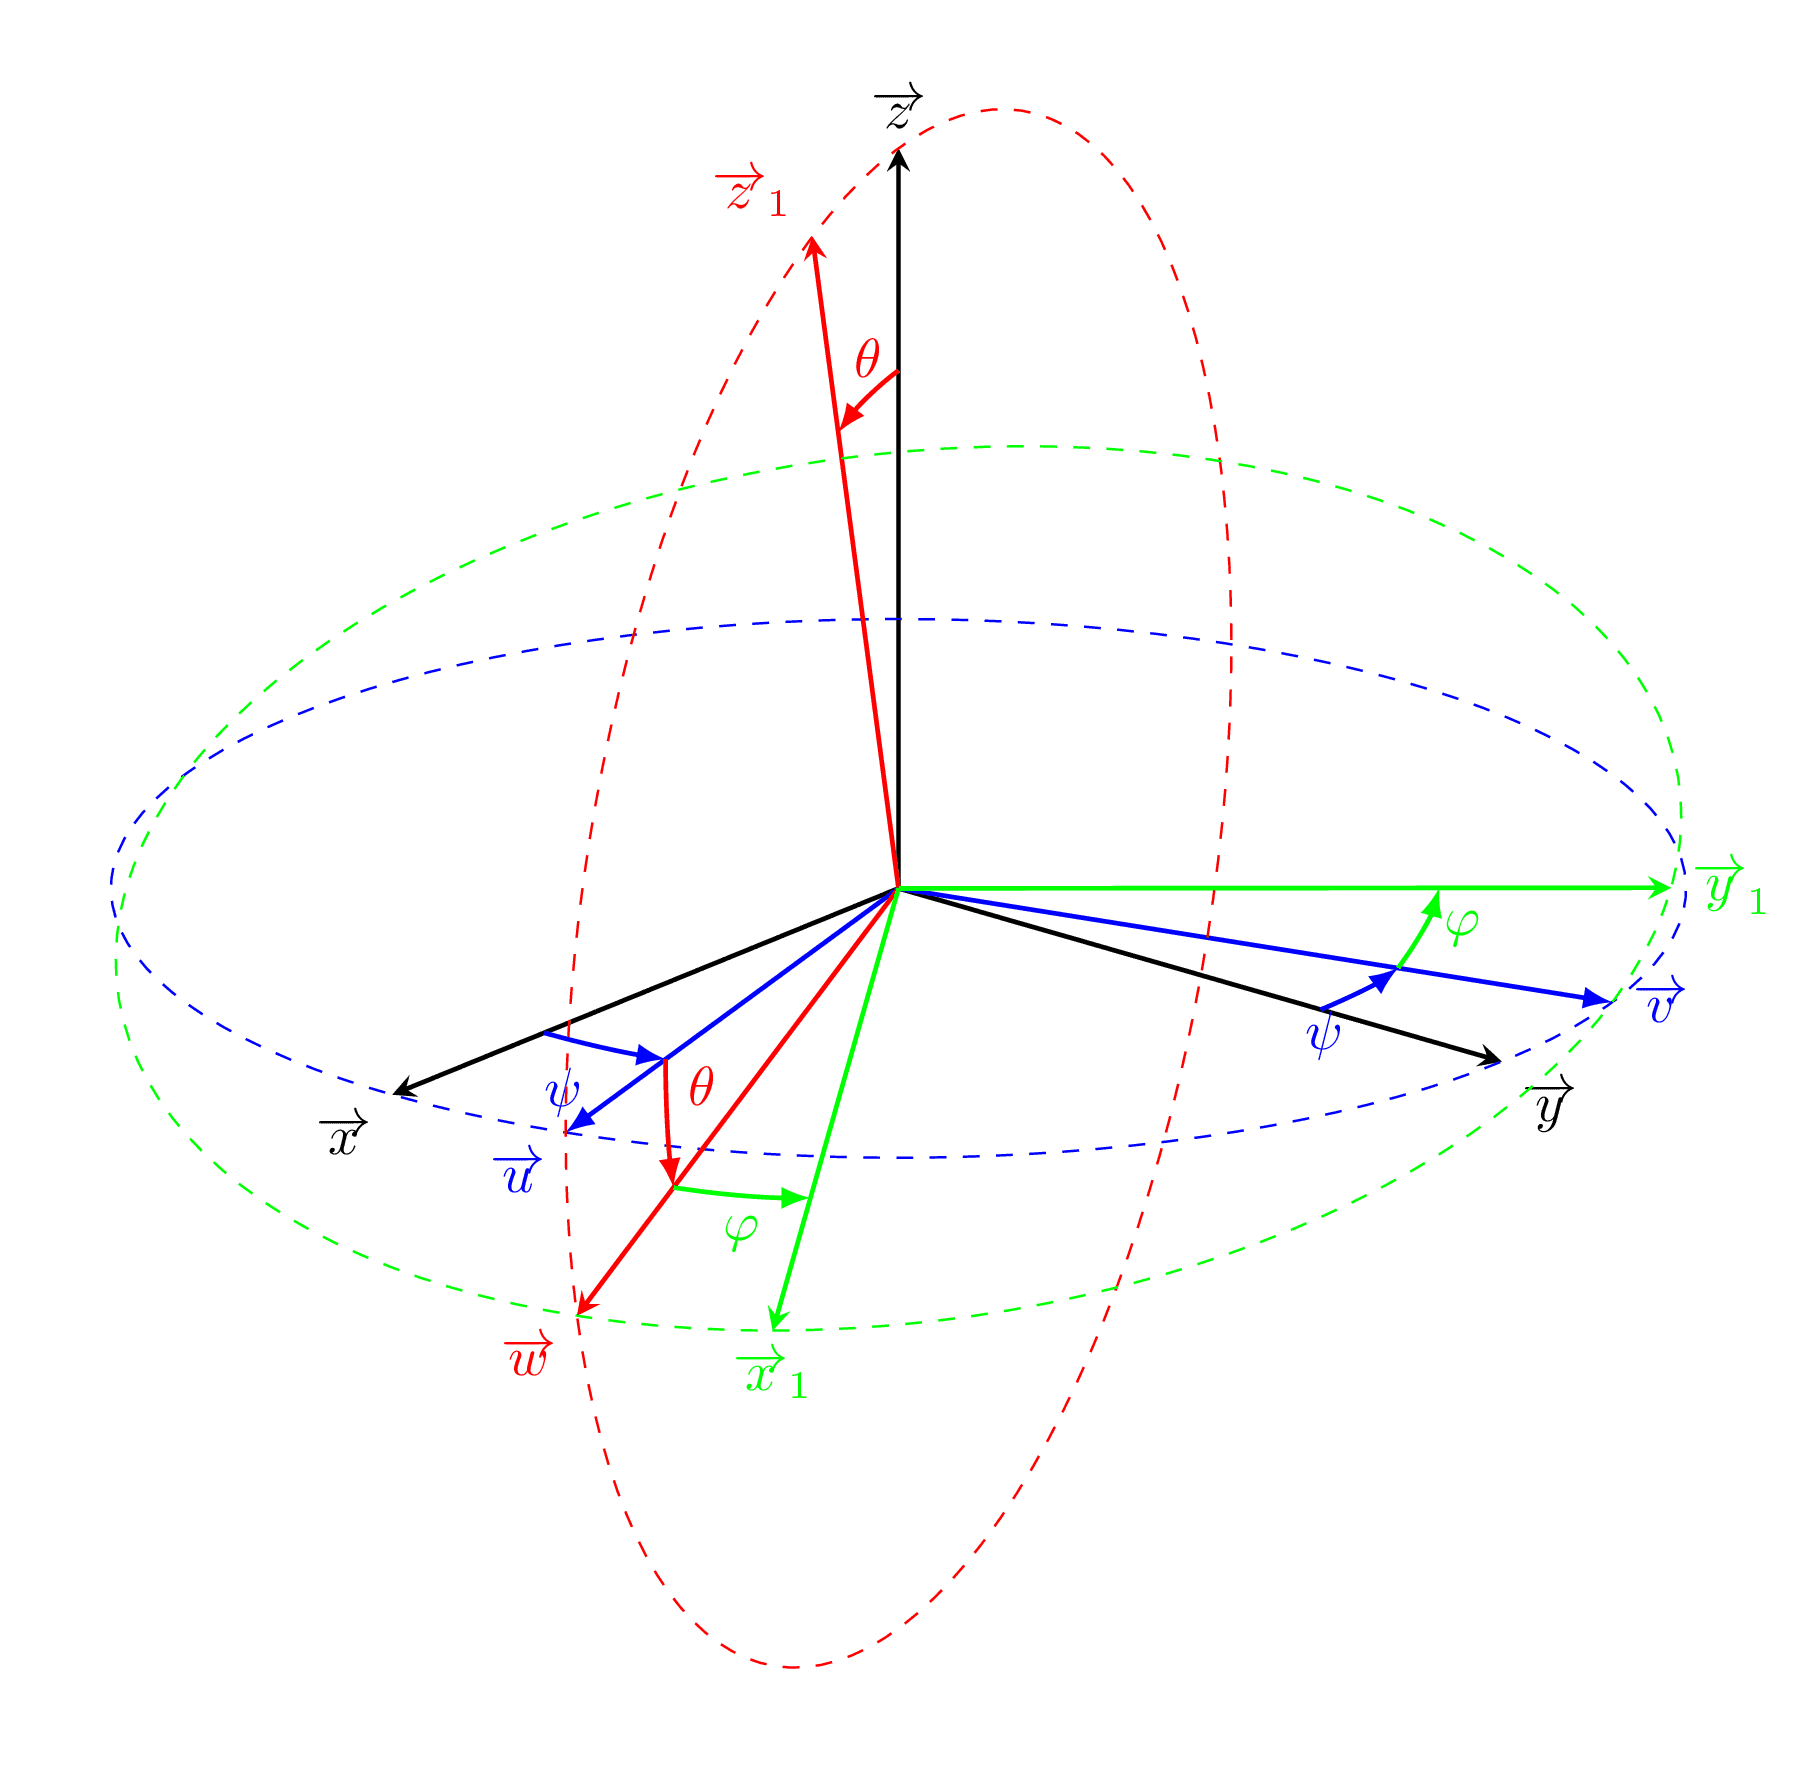
Euler Angles
Creator: Dorian Depriester (original)
Tags
Named after the mathematician Leonhard Euler, the 3 Euler angles describe arbitrary orientations in 3d w.r.t. to some coordinate system. They can also represent the orientation of a frame of reference in physics or of a general basis in 3d linear algebra.
Edit
Download
Code
euler-angles.tex (58 lines)
\documentclass[tikz]{standalone}

\usepackage{tikz-3dplot}

\begin{document}
\tdplotsetmaincoords{70}{130}

\begin{tikzpicture}[tdplot_main_coords, scale=5]
  %% Definition of the different styles
  \tikzstyle{init} = [black] % initial base
  \tikzstyle{prec} = [blue] % 1st intermediate base
  \tikzstyle{nuta} = [red] % 2nd initial base
  \tikzstyle{rotp} = [green] % final base
  \tikzstyle{base} = [thick, -stealth] % Base layout
  \tikzstyle{angle} = [thick, -latex] % Draw arcs for angles
  \tikzstyle{circle} = [thin, dashed] % Drawing circles

  %% Geometric parameters
  \def\epsi{15} % Precession angle drawn
  \def\etheta{15} % Nutation angle drawn
  \def\ephi{15} % Own rotation angle drawn
  \def\rang{0.7} % Radius used to draw angles

  %% Trace
  % Initial mark
  \coordinate (O) at (0,0,0);
  \draw[base, init] (O) -- (1,0,0) node[anchor=north east] {$\overrightarrow{x}$};
  \draw[base, init] (O) -- (0,1,0) node[anchor=north west] {$\overrightarrow{y}$};
  \draw[base, init] (O) -- (0,0, 1) node[anchor=south] {$\overrightarrow{z}$};

  % Precession
  \tdplotsetrotatedcoords{\epsi}{0}{0}
  \draw[tdplot_rotated_coords, angle, prec] (O) --(1,0,0) node[anchor=north east] {$\overrightarrow{u}$};
  \draw[tdplot_rotated_coords, angle, prec] (O) --(0,1,0) node[anchor=west] {$\overrightarrow{v}$};
  \tdplotdrawarc[tdplot_rotated_coords, circle, prec] {(0,0,0) }{1}{0}{360}{}{}
  \tdplotdrawarc[tdplot_rotated_coords, angle, prec] {(0,0,0)} {\rang}{90-\epsi}{90}{anchor=north east, prec}{$\psi$}
  \tdplotdrawarc[tdplot_rotated_coords, angle, prec] {(0,0,0)} {\rang}{-\epsi}{0}{anchor=north east, prec}{$\psi$}

  % Nutation
  \tdplotsetrotatedcoords{\epsi}{\etheta}{0}
  \draw[tdplot_rotated_coords, base, nuta] (O) --(1,0,0) node[anchor=north east] {$\overrightarrow{w}$};
  \draw[tdplot_rotated_coords, base, nuta] (O) --(0,0, 1) node[anchor=south east] {$\overrightarrow{z}_1$};
  \tdplotsetrotatedthetaplanecoords{0}
  \tdplotdrawarc[tdplot_rotated_coords, circle, nuta] {(0,0,0) }{1}{0}{360}{}{}
  \tdplotdrawarc[tdplot_rotated_coords, angle, nuta] {(0,0,0)} {\rang}{90-\etheta}{90}{anchor=south west, nuta}{$\theta$}
  \tdplotdrawarc[tdplot_rotated_coords, angle, nuta] {(0,0,0)} {\rang}{-\etheta}{0}{anchor=south, nuta}{$\theta$}

  % Proper Rotation
  \tdplotsetrotatedcoords{\epsi}{\etheta}{\ephi}
  \draw[tdplot_rotated_coords, base, rotp] (O) --(1,0,0) node[anchor=north] {$\overrightarrow{x}_1$};
  \draw[tdplot_rotated_coords, base, rotp] (O) --(0,1,0) node[anchor=west] {$\overrightarrow{y}_1$};
  \tdplotdrawarc[tdplot_rotated_coords, circle, rotp] {(0,0,0) }{1}{0}{360}{}{}
  \tdplotdrawarc[tdplot_rotated_coords, angle, rotp] {(0,0,0)} {\rang}{90-\ephi}{90}{anchor=west, rotp}{$\varphi$}
  \tdplotdrawarc[tdplot_rotated_coords, angle, rotp] {(0,0,0)} {\rang}{-\ephi}{0}{anchor=north, rotp}{$\varphi$}

\end{tikzpicture}
\end{document}