Saddle Point
Tags
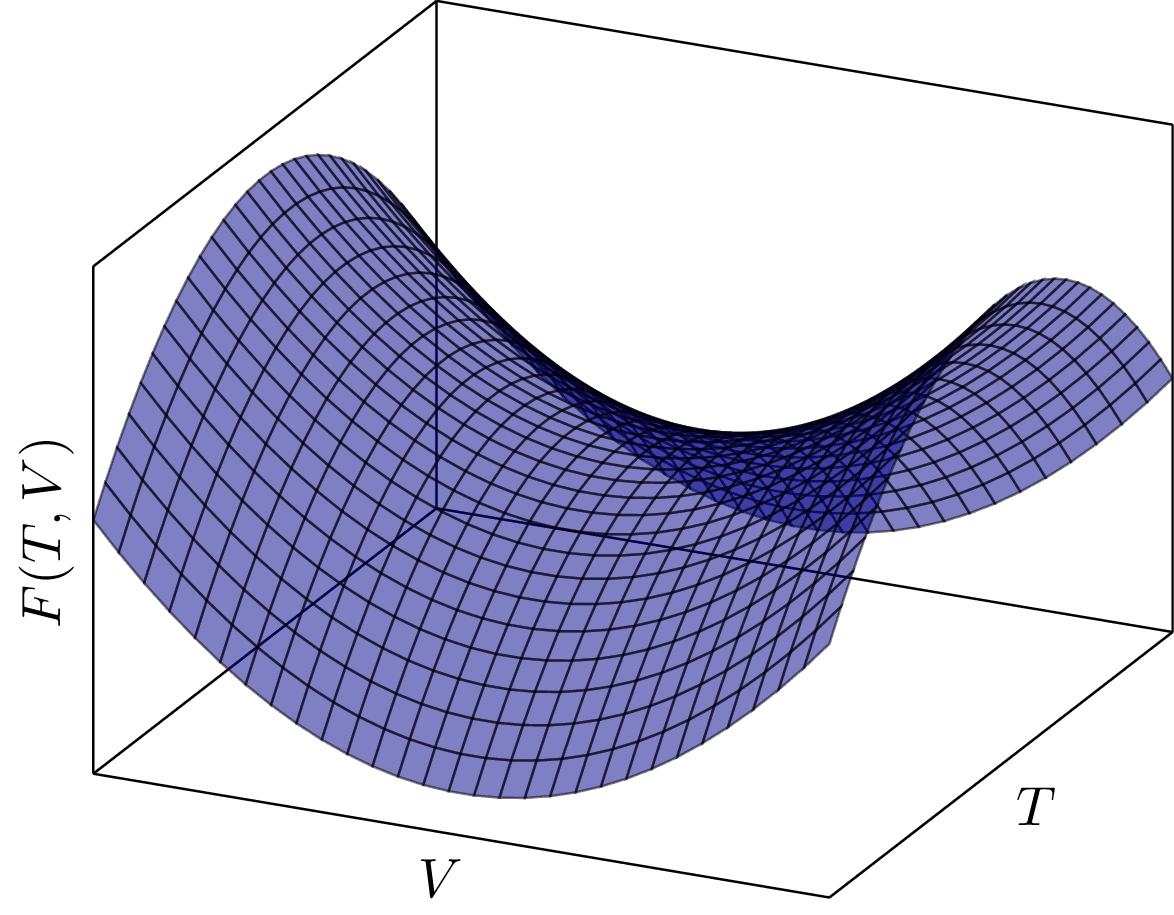
This graph depicts a saddle point in three-dimensional space, which is a point in the domain of a function that is a local minimum in one direction and a local maximum in another. The depicted function $F(T, V)$ is quadratic in $T$ and $V$, and the graph shows the convex and concave nature of the function along different axes.
Edit
Download
Code
saddle-point.tex (16 lines)
\documentclass[svgnames]{standalone}

\usepackage{pgfplots}
\pgfplotsset{compat=newest}

\begin{document}

\begin{tikzpicture}
  \begin{axis}[samples=30,ticks=none,xlabel={$V$},ylabel={$T$},zlabel={$F(T,V)$}]

    \addplot3[surf,color=DarkBlue,opacity=0.5,domain=-2:2,faceted color=black] {x^2-y^2};
  \end{axis}
\end{tikzpicture}

\end{document}