Jensens Inequality
Tags
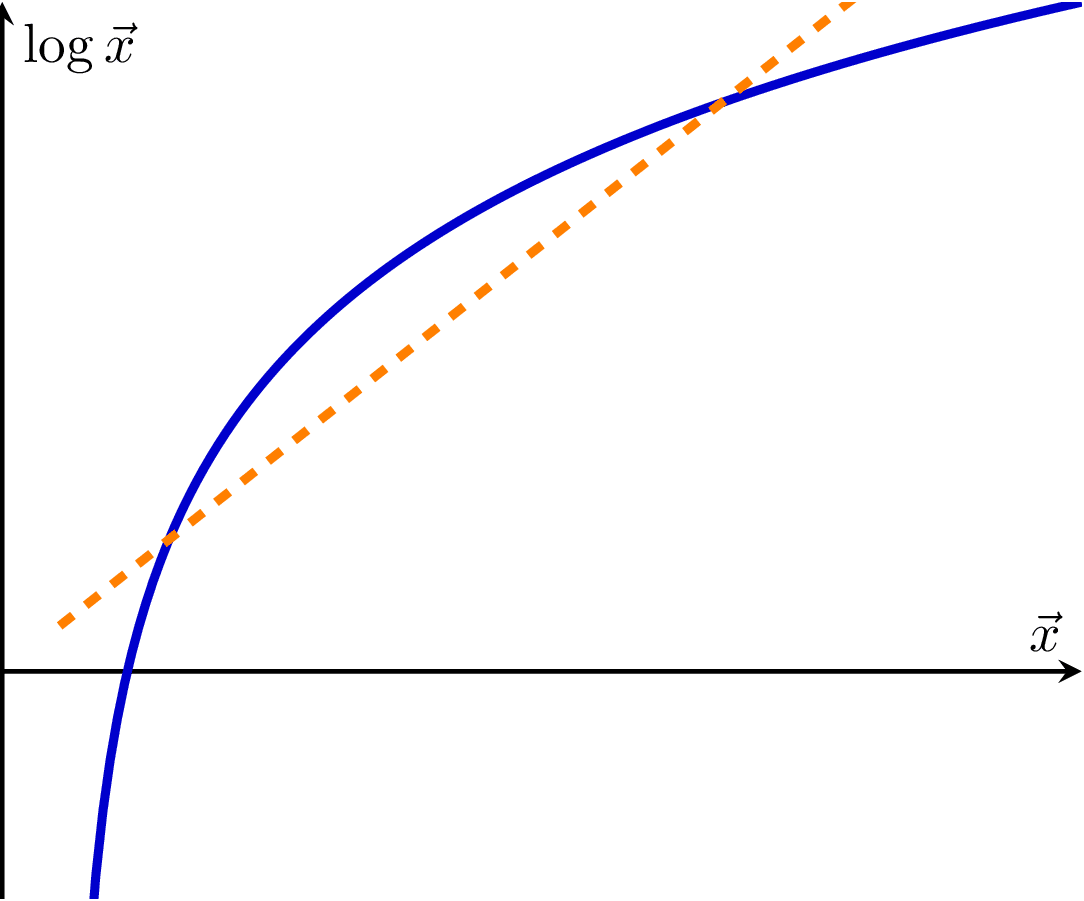
This graph illustrates Jensen's Inequality, a fundamental concept in mathematical optimization and probability theory. It compares a convex function (blue curve, representing the natural logarithm function) with a linear function (orange dashed line). The inequality states that for a convex function, the function of an expectation is always less than or equal to the expectation of the function, depicted here by the fact that the dashed line is always above the curve. Equality holds if and only if the random variable is a constant (i.e. there is no randomness).

Edit
Download
Code
jensens-inequality.tex (24 lines)
\documentclass{standalone}

\usepackage{pgfplots}
\pgfplotsset{compat=newest}

\begin{document}
\begin{tikzpicture}
  \begin{axis}[
      axis lines=middle,
      xtick=\empty,
      ytick=\empty,
      ylabel=$\log\vec x$,
      xlabel=$\vec x$,
      xmin=0,
      ymin=-1,
      thick,
      decoration={name=none},
    ]
    \addplot[no marks,blue!80!black,ultra thick,samples=150,domain=1:150] {ln(x-10)-2};
    \draw[orange,dashed,ultra thick] (axis cs:8, 0.2) -- (axis cs:120, 3);
  \end{axis}
\end{tikzpicture}
\end{document}